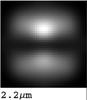
Fig. 7
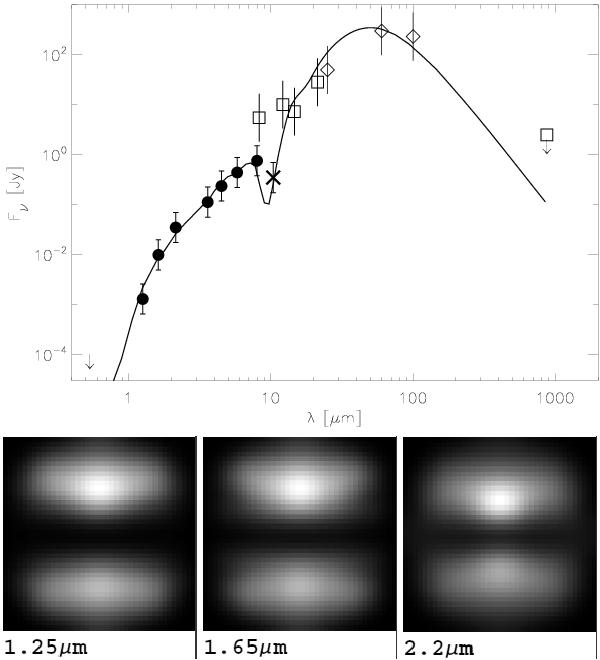
SED (above) and near-infrared model images (below) computed with RADMC. The solid dots in the SED plot show the HAWK-I and Spitzer data points, the open squares the MSX data, the thick X symbol the TIMMI2 measurement, the open diamonds the IRAS fluxes, and the open square the LABOCA flux. A square-root intensity scaling is used for the model images.
Current usage metrics show cumulative count of Article Views (full-text article views including HTML views, PDF and ePub downloads, according to the available data) and Abstracts Views on Vision4Press platform.
Data correspond to usage on the plateform after 2015. The current usage metrics is available 48-96 hours after online publication and is updated daily on week days.
Initial download of the metrics may take a while.