Fig. 5
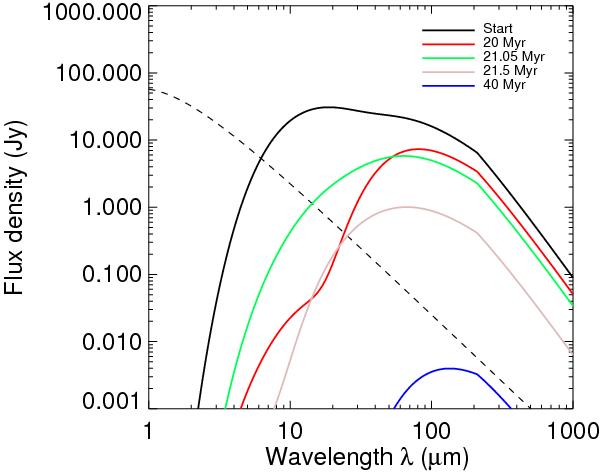
Evolution of the spectral energy distribution (SED) of the simulation from Fig. 2. Each curve shows the SED during a given simulation snapshot. The instability occurred at 21 Myr, and the SED evolved dramatically in the immediate aftermath, as icy planetesimals were scattered onto high-eccentricity orbits – thereby producing transient hot dust – and then ejected from the system. The dashed line represents the stellar photosphere. The system is viewed at a distance of 10 pc.
Current usage metrics show cumulative count of Article Views (full-text article views including HTML views, PDF and ePub downloads, according to the available data) and Abstracts Views on Vision4Press platform.
Data correspond to usage on the plateform after 2015. The current usage metrics is available 48-96 hours after online publication and is updated daily on week days.
Initial download of the metrics may take a while.