Free Access
Fig. 20
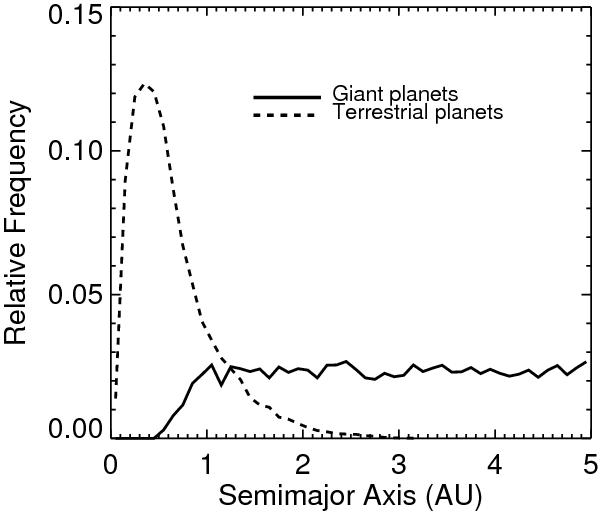
Semimajor axis distribution of simulated terrestrial planets (dashed line) from our set of simulations, derived by scaling the innermost surviving giant planet in each simulation to match an assumed underlying distribution for relevant exoplanets that increases linearly from zero at 0.5 AU and is constant from 1 − 5 AU.
Current usage metrics show cumulative count of Article Views (full-text article views including HTML views, PDF and ePub downloads, according to the available data) and Abstracts Views on Vision4Press platform.
Data correspond to usage on the plateform after 2015. The current usage metrics is available 48-96 hours after online publication and is updated daily on week days.
Initial download of the metrics may take a while.