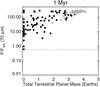
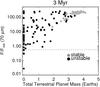
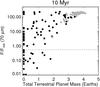
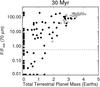
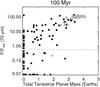
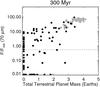
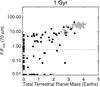
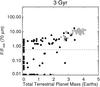
Fig. 17
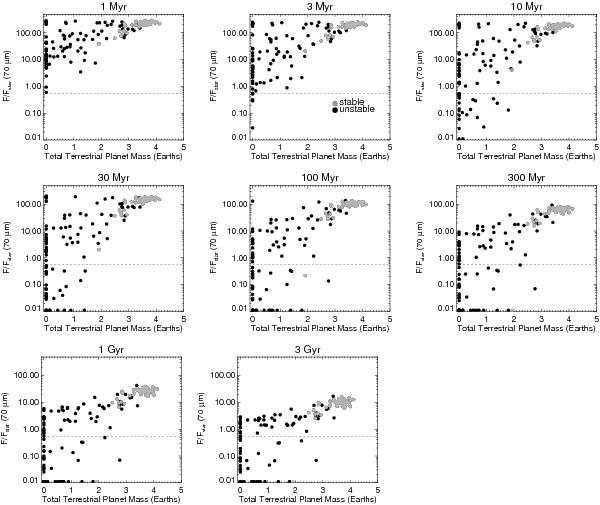
The dust-to-stellar flux ratio F/Fstar at 70 μm as a function of the total mass in terrestrial planets for eight different times from 1 Myr to 3 Gyr. The terrestrial planet mass refers to the final value such that simulations move vertically in time on the plot. The Spitzer observational limit is shown with the dashed line (Trilling et al. 2008). Grey circles represent stable simulations and black circles represent unstable simulations.
Current usage metrics show cumulative count of Article Views (full-text article views including HTML views, PDF and ePub downloads, according to the available data) and Abstracts Views on Vision4Press platform.
Data correspond to usage on the plateform after 2015. The current usage metrics is available 48-96 hours after online publication and is updated daily on week days.
Initial download of the metrics may take a while.