Fig. 16
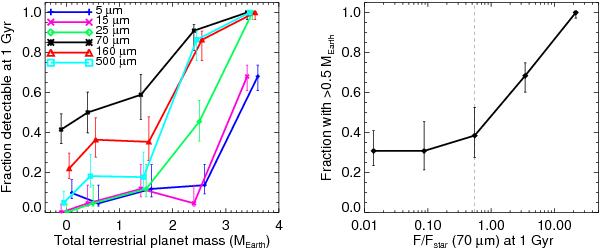
Left: the fraction of systems that would be detectable after 1 Gyr as a function of the total mass in surviving terrestrial planets for six different wavelengths between 5 and 500 μm. Each curve represents a horizontal slice through Fig. 15 at a different vertical height. The chosen “detection limits” in F/Fstar were: 10-8 at 5 μm, 10-3 at 15 μm, 0.054 at 25 μm, 0.55 at 70 μm, 10 at 160 μm, and 100 at 500 μm. The error bars are 1-σ and were calculated using binomial statistics (Burgasser et al. 2003). Note that the different curves are offset by up to ± 0.1 M⊕ for clarity. The bins themselves are at: zero, 0−1 M⊕, 1−2 M⊕, 2−3 M⊕, and > 3 M⊕. Right: the fraction of systems with 0.5 M⊕ or more in terrestrial planets as a function of F/Fstar(70 μm) (1 Gyr). Systems with F/Fstar < 10-2 are included in the bin at F/Fstar ≈ 10-2. The Spitzer detection limit is shown as the dashed line. This represents a vertical slice through Fig. 14.
Current usage metrics show cumulative count of Article Views (full-text article views including HTML views, PDF and ePub downloads, according to the available data) and Abstracts Views on Vision4Press platform.
Data correspond to usage on the plateform after 2015. The current usage metrics is available 48-96 hours after online publication and is updated daily on week days.
Initial download of the metrics may take a while.