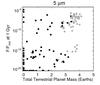
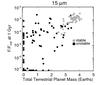
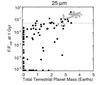
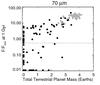
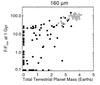
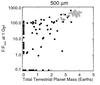
Fig. 15
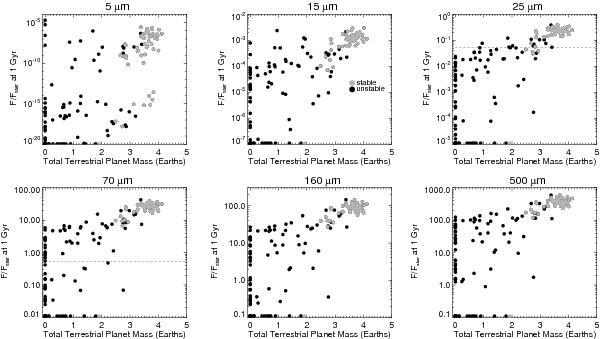
The dust-to-stellar flux ratio F/Fstar after 1 Gyr of dynamical and collisional evolution as a function of the total mass in terrestrial planets, for six wavelengths between 5 and 500 microns. The Spitzer observational limits are shown for 25 and 70 μm with the dashed line (Trilling et al. 2008). In each panel, grey circles represent stable simulations and black circles represent unstable simulations.
Current usage metrics show cumulative count of Article Views (full-text article views including HTML views, PDF and ePub downloads, according to the available data) and Abstracts Views on Vision4Press platform.
Data correspond to usage on the plateform after 2015. The current usage metrics is available 48-96 hours after online publication and is updated daily on week days.
Initial download of the metrics may take a while.