Fig. 14
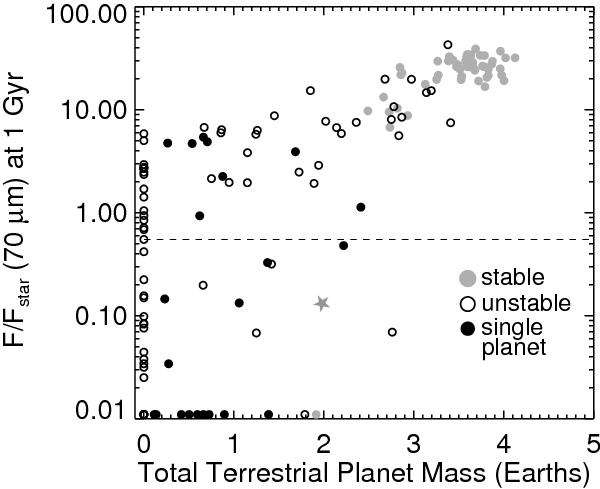
The dust-to-stellar flux ratio at 70 μm after 1 Gyr of dynamical and collisional evolution, plotted as a function of the total mass in terrestrial planets. Unstable systems are plotted in black and stable systems in grey. The pileups close to the x and y axes represent systems with either no terrestrial planets or virtually zero 70 μm flux. The dashed line represents an approximate threshold above which excess emission was detectable using Spitzer data (Trilling et al. 2008). The star shows the estimated flux from the Kuiper Belt at 1 Gyr, as calculated previously (Booth et al. 2009) using models based on dynamical simulations of the outer Solar System (Gomes et al. 2005). The Solar System falls into an intermediate region of parameter space: the giant planets may have been unstable, but only weakly so (there is no clear evidence for ejections or planetary collisions), while the Kuiper Belt would have been bright for several hundred Myr prior to the Late Heavy Bombardment.
Current usage metrics show cumulative count of Article Views (full-text article views including HTML views, PDF and ePub downloads, according to the available data) and Abstracts Views on Vision4Press platform.
Data correspond to usage on the plateform after 2015. The current usage metrics is available 48-96 hours after online publication and is updated daily on week days.
Initial download of the metrics may take a while.