Fig. 13
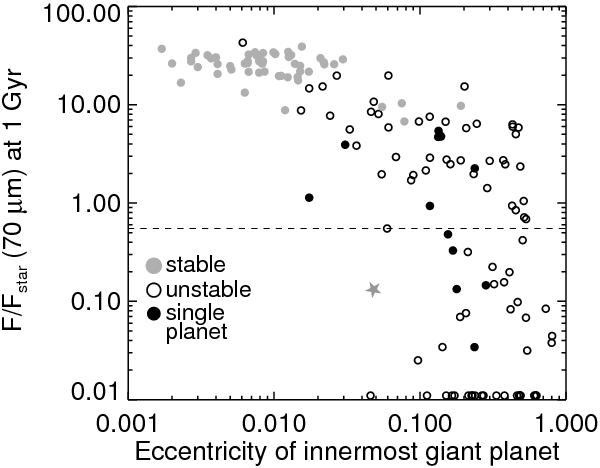
The dust-to-stellar flux ratio at 70 μm after 1 Gyr of dynamical and collisional evolution, plotted as a function of the eccentricity of the innermost surviving giant planet. Unstable systems are plotted in black and stable systems in grey (systems with a single surviving planet are shown with solid circles). The pileups very close to the x axis represent systems with virtually zero 70 μm flux. The dashed line represents an approximate threshold above which excess emission was detectable using Spitzer data (Trilling et al. 2008). The star shows the estimated flux from the Kuiper Belt at 1 Gyr, as calculated previously (Booth et al. 2009) based on dynamical simulations of the outer Solar System (Gomes et al. 2005).
Current usage metrics show cumulative count of Article Views (full-text article views including HTML views, PDF and ePub downloads, according to the available data) and Abstracts Views on Vision4Press platform.
Data correspond to usage on the plateform after 2015. The current usage metrics is available 48-96 hours after online publication and is updated daily on week days.
Initial download of the metrics may take a while.