Fig. 12
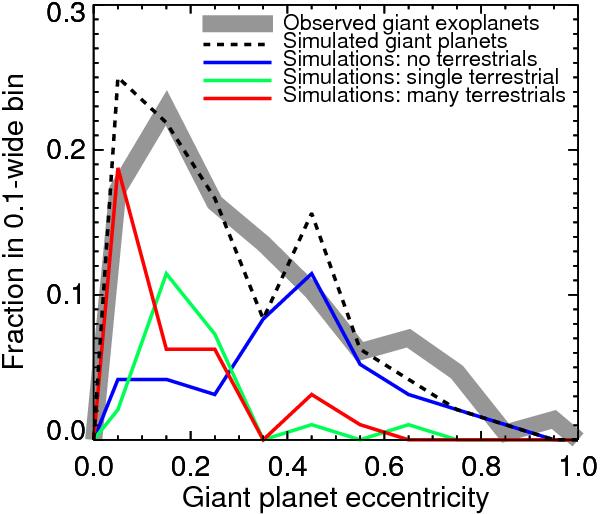
Distribution of eccentricities of the innermost giant planet in simulations which formed zero (blue line), one (green), and two or more (red) terrestrial planets. The sum of the three distributions (black dashed line) provides a quantitative match (p = 0.49 from a Kolmogorov-Smirnov test) to the observed exoplanets (thick grey line).
Current usage metrics show cumulative count of Article Views (full-text article views including HTML views, PDF and ePub downloads, according to the available data) and Abstracts Views on Vision4Press platform.
Data correspond to usage on the plateform after 2015. The current usage metrics is available 48-96 hours after online publication and is updated daily on week days.
Initial download of the metrics may take a while.