Fig. 8
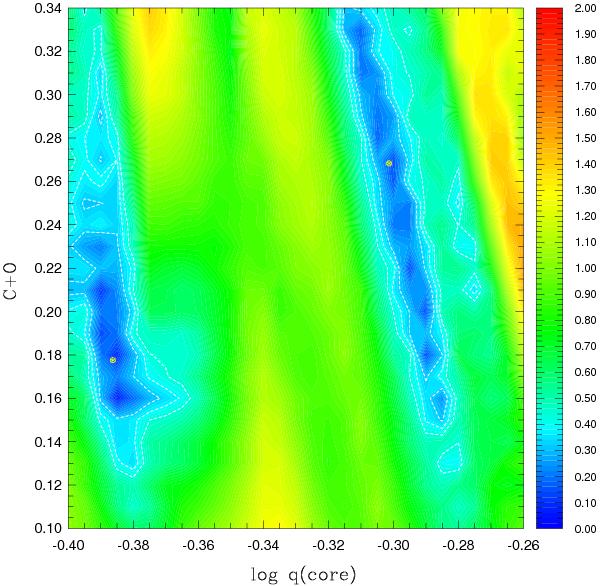
Expanded view of the
log q(core) − Xcore(C + O) region
where the two model solutions are found. The map represents
 , a “projection” of the 4-dimensional
S2 function (in log scale): at each
log q(core), Xcore(C + O) position,
the value given is the minimum of log S2 that can be
found among the values obtained for all M∗ and
log q(H). White contours show regions where the
frequency matches have S2 values within, respectively,
the 1σ , 2σ , and 3σ confidence
levels relative to the best-fit solution. The yellow marks indicate the positions of
the two solutions found by the optimization code.
, a “projection” of the 4-dimensional
S2 function (in log scale): at each
log q(core), Xcore(C + O) position,
the value given is the minimum of log S2 that can be
found among the values obtained for all M∗ and
log q(H). White contours show regions where the
frequency matches have S2 values within, respectively,
the 1σ , 2σ , and 3σ confidence
levels relative to the best-fit solution. The yellow marks indicate the positions of
the two solutions found by the optimization code.
Current usage metrics show cumulative count of Article Views (full-text article views including HTML views, PDF and ePub downloads, according to the available data) and Abstracts Views on Vision4Press platform.
Data correspond to usage on the plateform after 2015. The current usage metrics is available 48-96 hours after online publication and is updated daily on week days.
Initial download of the metrics may take a while.