Fig. 6
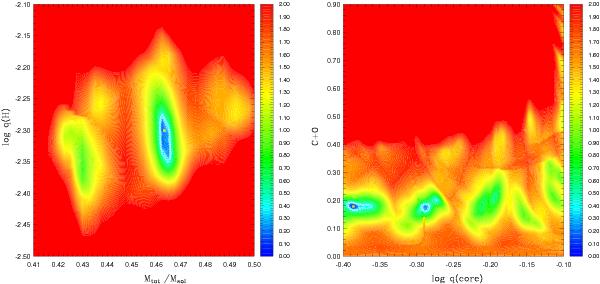
Left panel: slice of the S2 function (in logarithmic units) along the M∗ − log q(H) plane with the parameters log q(core) and Xcore(C + O) fixed to their optimal values obtained in the best-fit seismic model 1. Right panel: slice of the S2 function (in log) along the log q(core) − Xcore(C + O) plane with the parameters M∗ and log q(H) fixed to their optimal values. White contours show regions where the frequency fits have S2 values within, respectively, the 1σ, 2σ, and 3σ confidence levels relative to the best-fit solution.
Current usage metrics show cumulative count of Article Views (full-text article views including HTML views, PDF and ePub downloads, according to the available data) and Abstracts Views on Vision4Press platform.
Data correspond to usage on the plateform after 2015. The current usage metrics is available 48-96 hours after online publication and is updated daily on week days.
Initial download of the metrics may take a while.