Fig. 3
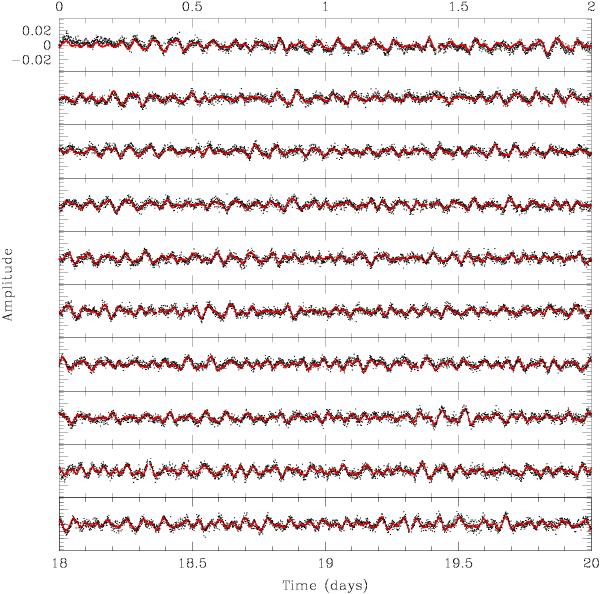
Twenty day section of the light curve obtained for KIC02697388 during Q2.3 Kepler observations. The amplitude as a function of time is expressed in terms of the residual relative to the mean brightness intensity of the star. The red curve shows the reconstructed signal based on the extracted frequencies, amplitudes, and phases given in Table 1.
Current usage metrics show cumulative count of Article Views (full-text article views including HTML views, PDF and ePub downloads, according to the available data) and Abstracts Views on Vision4Press platform.
Data correspond to usage on the plateform after 2015. The current usage metrics is available 48-96 hours after online publication and is updated daily on week days.
Initial download of the metrics may take a while.