Fig. 2
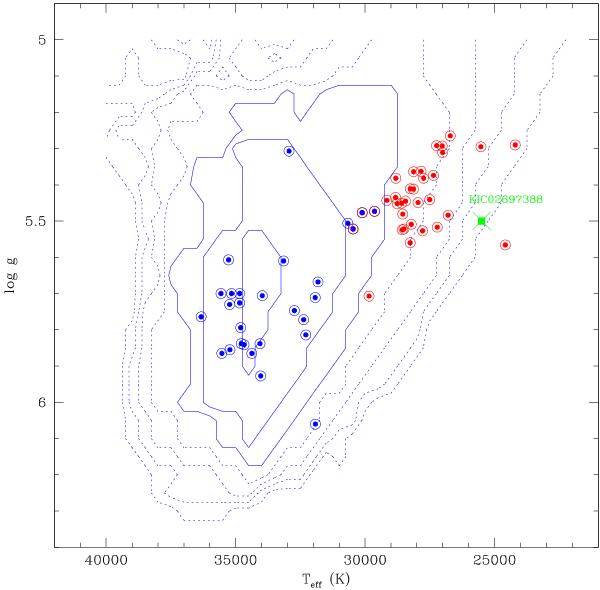
Distribution of the hot B subdwarf pulsators in the log g − Teff plane from a sample of 28 short-period (out of 51 known; in blue) and 33 long-period (out of 45 known; in red) sdB pulsators. Three stars in this sample show both long- and short-period pulsations (blue filled circles within a red annulus). We stress that the plotted stars form a homogeneous sample in terms of the determination of their atmospheric parameters (based on our NLTE metal-free H/He model atmospheres). On the same homogeneous scale, the green square with a cross marks the position of KIC02697388. The overplotted blue contours indicate the number of driven ℓ = 0 p-modes (the largest contour corresponds to one driven mode) and manifest the p-mode instability region derived from models assuming iron distributions at equilibrium between gravitational settling and radiative levitation (Charpinet et al. 2001). Nearly all p-mode pulsators are concentrated within the three highest contours (solid lines) where driving is most efficient.
Current usage metrics show cumulative count of Article Views (full-text article views including HTML views, PDF and ePub downloads, according to the available data) and Abstracts Views on Vision4Press platform.
Data correspond to usage on the plateform after 2015. The current usage metrics is available 48-96 hours after online publication and is updated daily on week days.
Initial download of the metrics may take a while.