Fig. 1
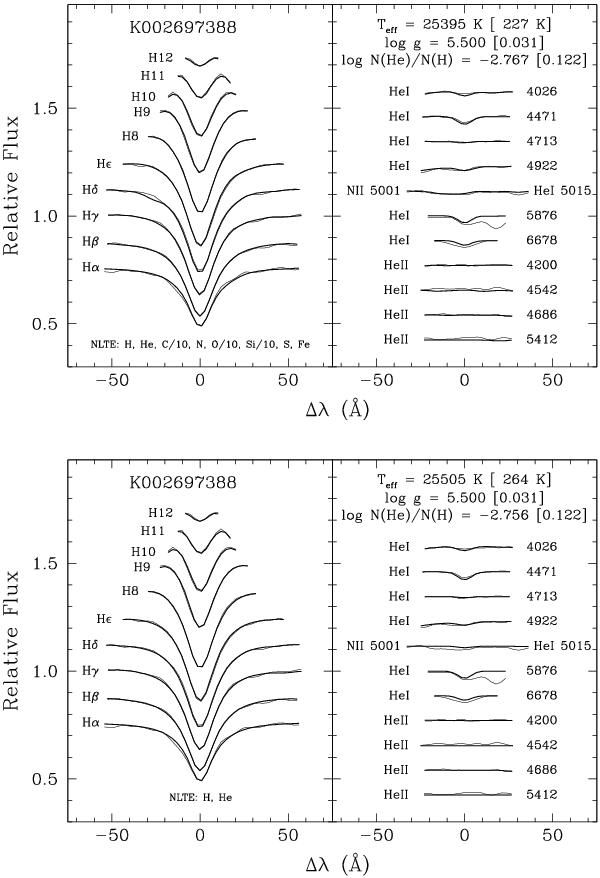
Upper panel: model fit (heavy curve) to all the hydrogen and strong helium lines (thin curve) available in our high S/N, low-resolution optical spectrum of KIC 02697388. The fit was done using a 3D grid of NLTE synthetic spectra (Teff , log g, log N(He) /N(H)) in which the abundances of C, N, O, S, Si, and Fe were held fixed at amounts consistent with Blanchette et al. (2008). Lower panel: similar, but for a 3D grid of NLTE synthetic spectra without metals.
Current usage metrics show cumulative count of Article Views (full-text article views including HTML views, PDF and ePub downloads, according to the available data) and Abstracts Views on Vision4Press platform.
Data correspond to usage on the plateform after 2015. The current usage metrics is available 48-96 hours after online publication and is updated daily on week days.
Initial download of the metrics may take a while.