Fig. 4
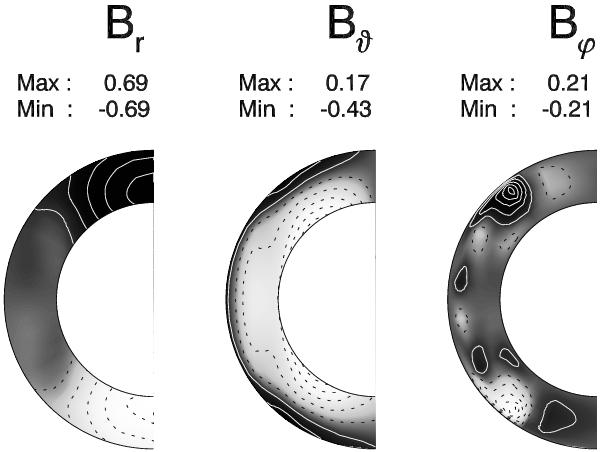
Leading dipolar eigenmode resulting from a mean-field calculation with arr = aθθ = 0. Contour plots of all three components are presented, each normalised separately by their maximum absolute values. Maxima and minima are written next to each plot. The colour–coding ranges from − 1, white, to + 1, black, and contour lines correspond to ± 0.1, ± 0.3, ± 0.5, ± 0.7 and ± 0.9.
Current usage metrics show cumulative count of Article Views (full-text article views including HTML views, PDF and ePub downloads, according to the available data) and Abstracts Views on Vision4Press platform.
Data correspond to usage on the plateform after 2015. The current usage metrics is available 48-96 hours after online publication and is updated daily on week days.
Initial download of the metrics may take a while.