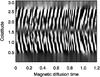
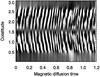
Fig. 2
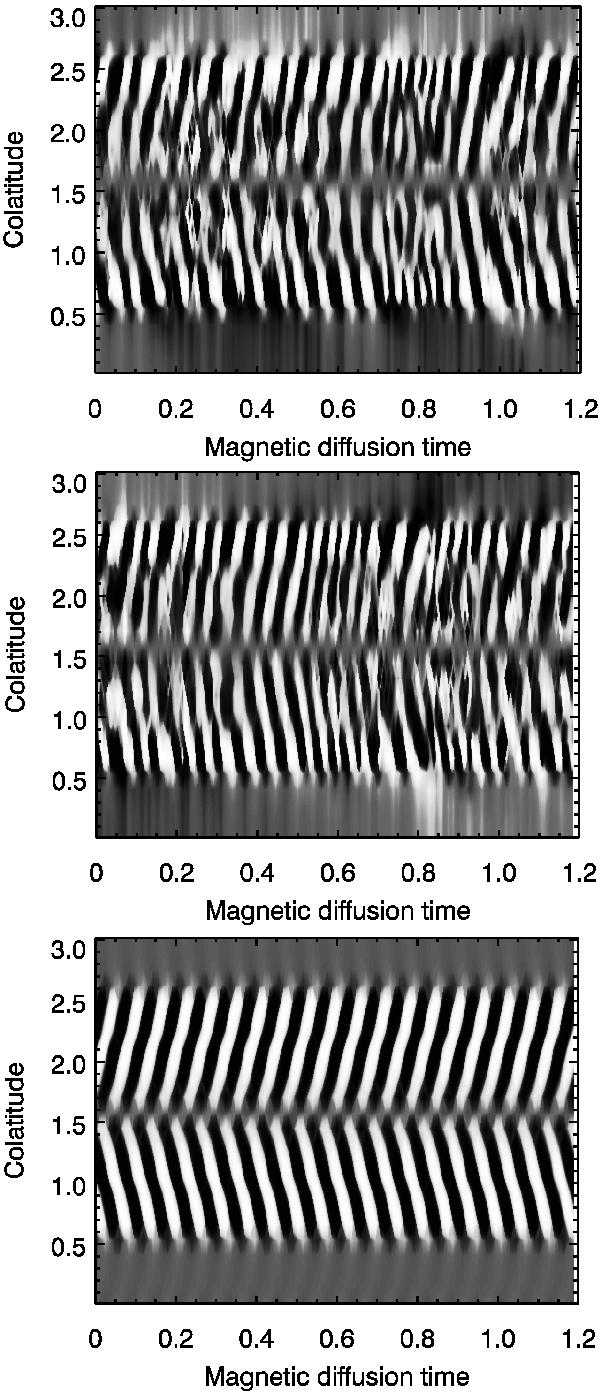
Azimuthally averaged radial magnetic field at the outer shell boundary varying with time (butterfly diagram) resulting from a self-consistent calculation (top), kinematic calculation according to (8) (middle) and mean-field calculation (bottom). The contour plots were normalised by their maximum absolute value at each time step considered. The colour–coding ranges from − 1, white, to + 1, black.
Current usage metrics show cumulative count of Article Views (full-text article views including HTML views, PDF and ePub downloads, according to the available data) and Abstracts Views on Vision4Press platform.
Data correspond to usage on the plateform after 2015. The current usage metrics is available 48-96 hours after online publication and is updated daily on week days.
Initial download of the metrics may take a while.