Fig. 3
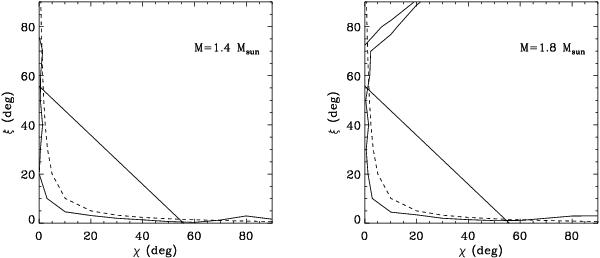
Left: the contour of constant PF = 0.04 (solid line) for the case rO = 15 km, d = 150 pc, TO = 11 eV, rX = 1 km, and M = 1.4 M⊙. The dashed line shows the analytical result for point-like caps (see text for details). Pulse profiles are class I according to the classification of Beloborodov (2002); i.e., they do not exhibit flat intervals, only when the contour is below the straight line. Right: same for M = 1.8 M⊙.
Current usage metrics show cumulative count of Article Views (full-text article views including HTML views, PDF and ePub downloads, according to the available data) and Abstracts Views on Vision4Press platform.
Data correspond to usage on the plateform after 2015. The current usage metrics is available 48-96 hours after online publication and is updated daily on week days.
Initial download of the metrics may take a while.