Fig. 2
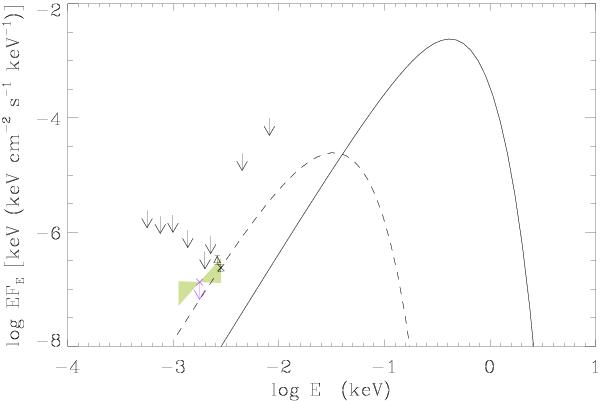
Optical/X-ray spectral energy distribution of RBS 1774. The solid line represents the updated best-fit model spectrum (kT ~ 104 eV; NH ~ 2.6 × 1020 cm-2) to the XMM-Newton data. The arrows represent the 5σ optical/IR flux upper limits reported by Rea et al. (2007) and the 3σ near/far-ultraviolet flux upper limits derived from archival GALEX observations (see text). The VLT B-band flux of the RBS 1774 candidate counterpart is marked by the cross, while our VLT R-band upper limit is marked by the cross and the arrow. The LBT B-band measurement (Schwope et al. 2009) is marked by the triangle. The shaded areas represent the region described by the two PLs with slopes α = −2.07 and 0.07, which pass ± 3σ above/below the B-band flux and are consistent with our R-band upper limit (see text for details). Optical points have been corrected for the NH obtained from the updated fit to the XMM-Newton spectrum (see text). The dashed line represents the blackbody at TO = 11 eV (rO = 15 km, d = 150 pc), normalised to our VLT B band point and compatible with the R-band upper limit.
Current usage metrics show cumulative count of Article Views (full-text article views including HTML views, PDF and ePub downloads, according to the available data) and Abstracts Views on Vision4Press platform.
Data correspond to usage on the plateform after 2015. The current usage metrics is available 48-96 hours after online publication and is updated daily on week days.
Initial download of the metrics may take a while.