Fig. 5
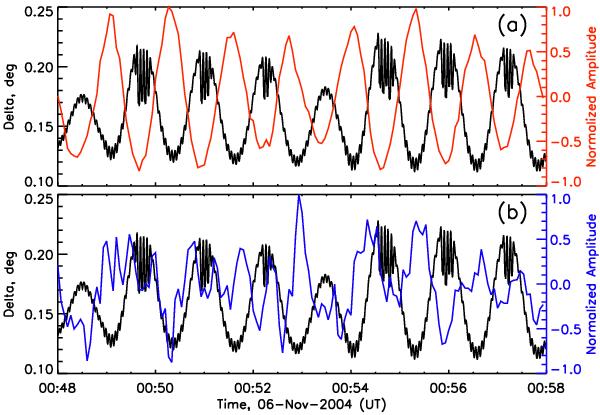
Variations in the distance between the flare source position and telescope position (black), and variations in smoothed, detrended, and normalized RHESSI count rates from detectors 5 (top panel, red) and 8 (bottom panel, blue) at 6–12 keV. Note that the two profiles are normalized independently and are in reality of different amplitudes (see Fig. 6).
Current usage metrics show cumulative count of Article Views (full-text article views including HTML views, PDF and ePub downloads, according to the available data) and Abstracts Views on Vision4Press platform.
Data correspond to usage on the plateform after 2015. The current usage metrics is available 48-96 hours after online publication and is updated daily on week days.
Initial download of the metrics may take a while.