Fig. 4
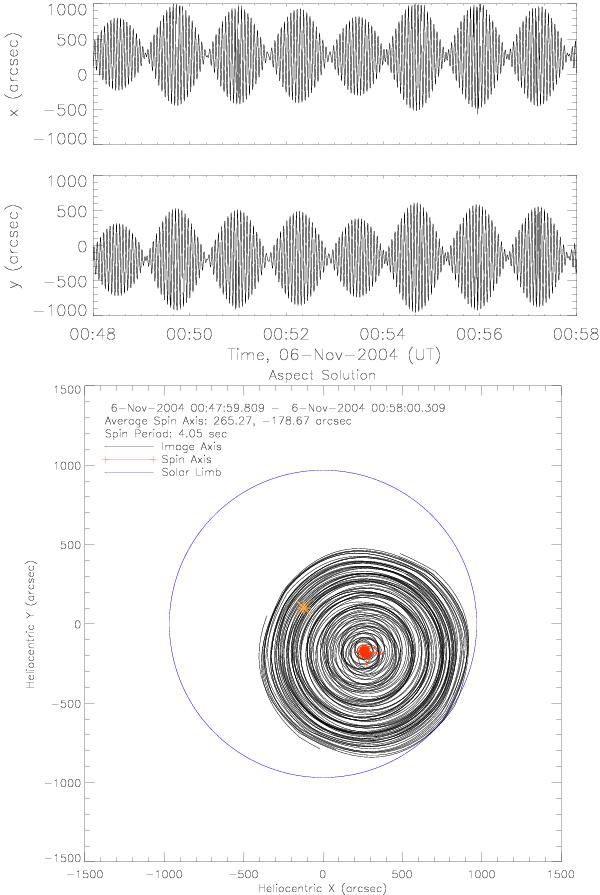
Top: RHESSI imaging axis pointing variations in x and y during the flare of 2004 November 6, showing the 4 s spin period and the 75 s nutation period. Here the 4 s rotation period is in the fine structure and is surrounded by the visible 75 s envelope. Bottom: RHESSI aspect solution, showing the varying location of the imaging axis (black) and spin axis (red) between 00:48 and 00:58 UT. The flare location is shown by the asterisk in yellow.
Current usage metrics show cumulative count of Article Views (full-text article views including HTML views, PDF and ePub downloads, according to the available data) and Abstracts Views on Vision4Press platform.
Data correspond to usage on the plateform after 2015. The current usage metrics is available 48-96 hours after online publication and is updated daily on week days.
Initial download of the metrics may take a while.