Fig. 3
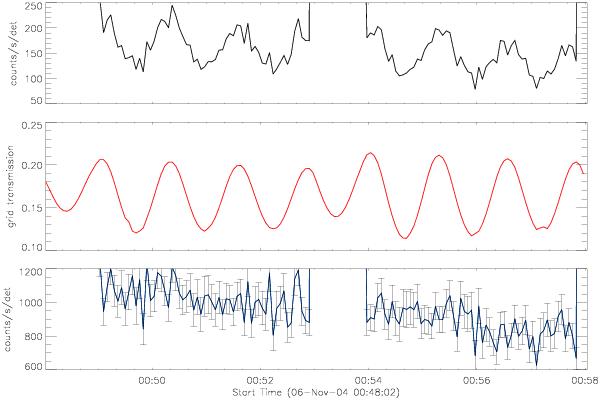
Top: RHESSI count rates detected on 2004, November 6 in the 6–12 keV range using detector 5, corrected for livetime only. Center: grid transmission coefficients obtained for detector 5 as a function of time. Bottom: RHESSI count rates in the 6–12 keV range using detector 5, corrected for livetime and grid transmission. The error bars show the uncertainty due to Poisson statistics.
Current usage metrics show cumulative count of Article Views (full-text article views including HTML views, PDF and ePub downloads, according to the available data) and Abstracts Views on Vision4Press platform.
Data correspond to usage on the plateform after 2015. The current usage metrics is available 48-96 hours after online publication and is updated daily on week days.
Initial download of the metrics may take a while.