Fig. 10
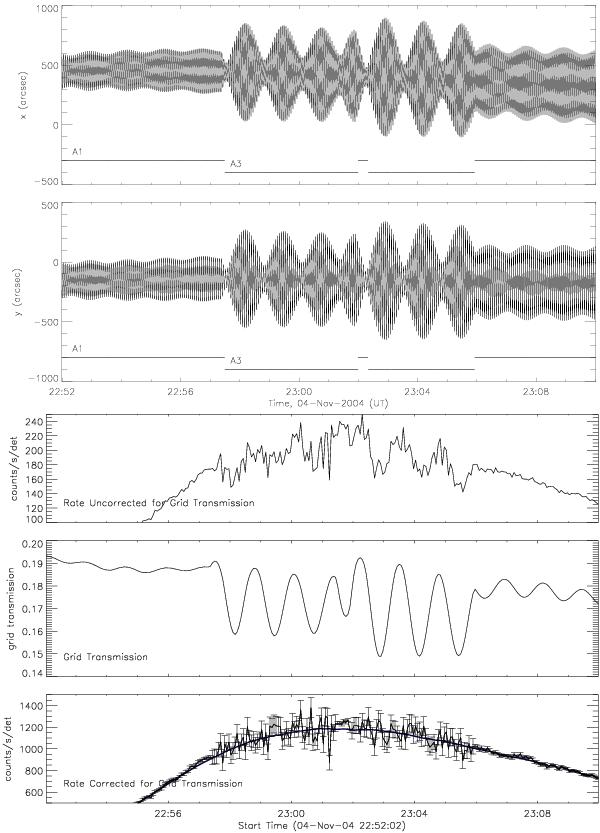
Top: RHESSI imaging axis pointing variations in x and y during the impulsive phase of the 2004 November 4 flare. Changes in pointing modulation amplitude correspond to changes in attenuator state, from A1 to A3 at 22:57 UT, A3 to A1 and back to A3 at 23:02 UT, and finally A3 to A1 at 23:06 UT. As before the 4 s rotation period is in the fine structure, while the 75 s envelope is clearly visible. Bottom: uncorrected count rates detected in the 6–12 keV energy range by detector 5, grid transmission coefficient, and count rates corrected for grid transmission. The count rates in this figure have been scaled to account for attenuator state changes, hence the differing error bar sizes, which are based on Poisson statistics. The solid curve is the original data smoothed by a 50-point boxcar function.
Current usage metrics show cumulative count of Article Views (full-text article views including HTML views, PDF and ePub downloads, according to the available data) and Abstracts Views on Vision4Press platform.
Data correspond to usage on the plateform after 2015. The current usage metrics is available 48-96 hours after online publication and is updated daily on week days.
Initial download of the metrics may take a while.