Fig. 7
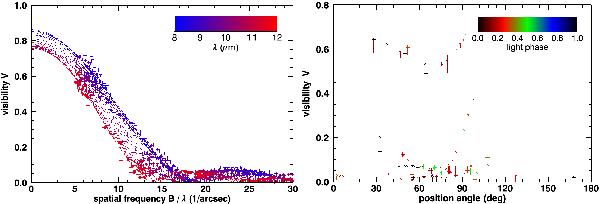
Left: same as left hand panel of Fig. 6, but for all 25 wavelength bins. Clearly the first zero shifts to lower spatial frequencies with increasing wavelength, i.e. the FDD diameter increases with increasing wavelength. Right: visibility as function of position angle for wavelength bin 6 (9.07 μm). Measurements (crosses) are connected with their corresponding circular FDD model points (small open circles) showing that there is a systematic shift in the difference, Vmodel − Vmeasurement, by going from 0° to 90°. For data points with low visibilities, corresponding to data in the increasing part of the second lobe, the systematic is inverse. See Sect. 4 for a detailed interpretation.
Current usage metrics show cumulative count of Article Views (full-text article views including HTML views, PDF and ePub downloads, according to the available data) and Abstracts Views on Vision4Press platform.
Data correspond to usage on the plateform after 2015. The current usage metrics is available 48-96 hours after online publication and is updated daily on week days.
Initial download of the metrics may take a while.