Fig. 5
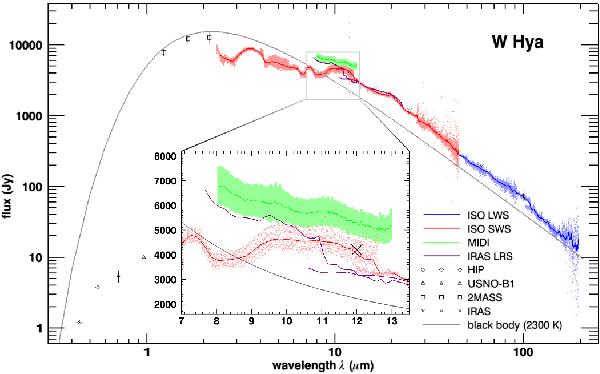
Spectral energy distribution of W Hya. The included Photometry is not corrected for reddening effects and the black body curve is only included for guidance. The ISO LWS and SWS spectra from observation epochs 1996-02-07 and 1992-02-14 are used, respectively. The MIDI spectrum (green, where light green are the errors) does not show the silicate emission feature at around 10 microns. The MIDI spectrum is shown in the inset in more detail.
Current usage metrics show cumulative count of Article Views (full-text article views including HTML views, PDF and ePub downloads, according to the available data) and Abstracts Views on Vision4Press platform.
Data correspond to usage on the plateform after 2015. The current usage metrics is available 48-96 hours after online publication and is updated daily on week days.
Initial download of the metrics may take a while.