Fig. 3
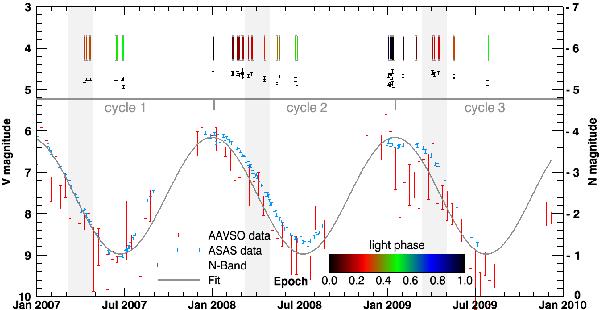
The visual light curve of W Hya, covering the period of the MIDI observations. The V magnitudes are from AAVSO (10 day bins) and ASAS. A simple sinusoidal fit is included to determine the phases used throughout this paper. The times of the MIDI observations are included as tick marks above the curve and are color-coded by visual light phase. The MIDI flux at around 12 μm is shown directly below the tick marks with the magnitude scale given on the right. The data within the three shaded regions are used for cycle-to-cycle studies in Sect. 4.3.
Current usage metrics show cumulative count of Article Views (full-text article views including HTML views, PDF and ePub downloads, according to the available data) and Abstracts Views on Vision4Press platform.
Data correspond to usage on the plateform after 2015. The current usage metrics is available 48-96 hours after online publication and is updated daily on week days.
Initial download of the metrics may take a while.