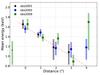
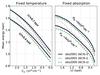
Fig. 5

Trend of mean energies, stripes are those of Fig. 6. Photons used within 0.5–3.0 keV. The red dash-dotted line is intended to guide the eye in the lower panel. Top: thick symbols indicate data points with more than three photons while the smaller symbols refer to data points with fewer photons. Errors are obtained using the simulations of Sect. 4.1.2. Bottom: simulations for fixed temperature and fixed absorption along the jet axis.
Current usage metrics show cumulative count of Article Views (full-text article views including HTML views, PDF and ePub downloads, according to the available data) and Abstracts Views on Vision4Press platform.
Data correspond to usage on the plateform after 2015. The current usage metrics is available 48-96 hours after online publication and is updated daily on week days.
Initial download of the metrics may take a while.