Fig. 2
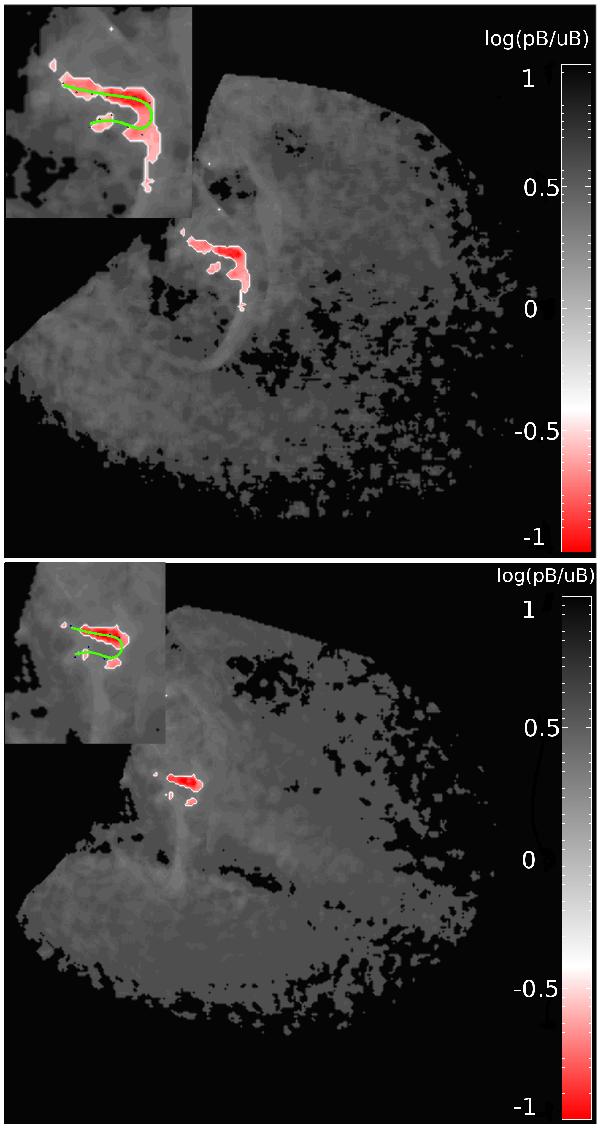
Ratio pB/uB of polarised to unpolarised light from COR1 of STEREO spacecraft A (upper panel) and B (lower panel). The ratio is colour-coded and the red patches mark low polarised values. The upper left insert is a zoom of this region with the green line representing the projection of the 3D curve fit to the patches location obtained from stereoscopic triangulation.
Current usage metrics show cumulative count of Article Views (full-text article views including HTML views, PDF and ePub downloads, according to the available data) and Abstracts Views on Vision4Press platform.
Data correspond to usage on the plateform after 2015. The current usage metrics is available 48-96 hours after online publication and is updated daily on week days.
Initial download of the metrics may take a while.