Free Access
Fig. 8
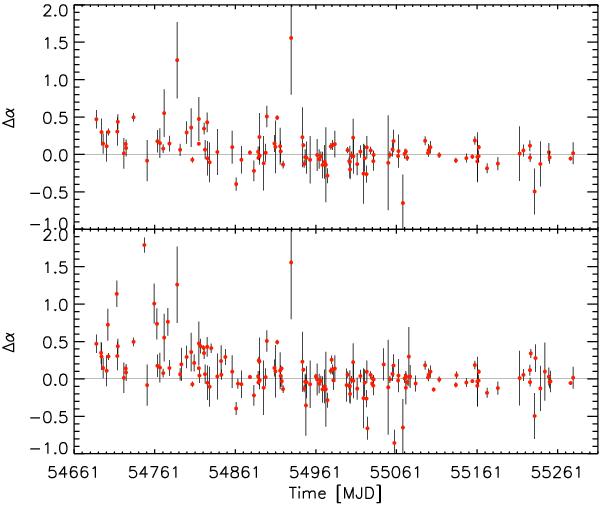
Difference between α values reported in the GCN Circulars and α values derived from our analysis. Top panel: bursts for which the spectrum is described by the same model both in our analysis and in the GCN analysis. Bottom panel: bursts common to both samples regardless of the spectral model chosen to describe the spectrum.
Current usage metrics show cumulative count of Article Views (full-text article views including HTML views, PDF and ePub downloads, according to the available data) and Abstracts Views on Vision4Press platform.
Data correspond to usage on the plateform after 2015. The current usage metrics is available 48-96 hours after online publication and is updated daily on week days.
Initial download of the metrics may take a while.