Fig. 7
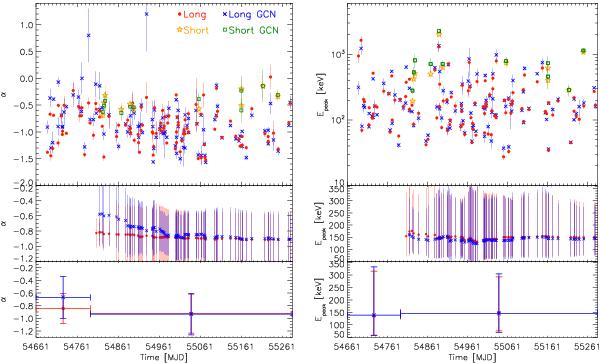
Comparison of GCN preliminary results and our analysis. Upper panel: crosses and squares show (for long and short events respectively) the time trend of the spectral properties (α on the left and  on the right) for GBM bursts whose preliminary spectral analysis has been reported in the GCN circulars. Circles and stars show the same for the sample of long and short bursts analyzed by us. We show only those bursts for which the same spectral models were used in our analysis and in the analysis reported in the GCN circulars. Time on the x-axis is in MJD units. Middle panels: central values and 1σ width for the α (left) and (right) distributions (long bursts only) for the GCN sample (crosses) and our sample (circles) as a function of time. Bottom panels show the average α and for two different periods of time, up to and after December 2008.
Current usage metrics show cumulative count of Article Views (full-text article views including HTML views, PDF and ePub downloads, according to the available data) and Abstracts Views on Vision4Press platform.
Data correspond to usage on the plateform after 2015. The current usage metrics is available 48-96 hours after online publication and is updated daily on week days.
Initial download of the metrics may take a while.