Fig. 2
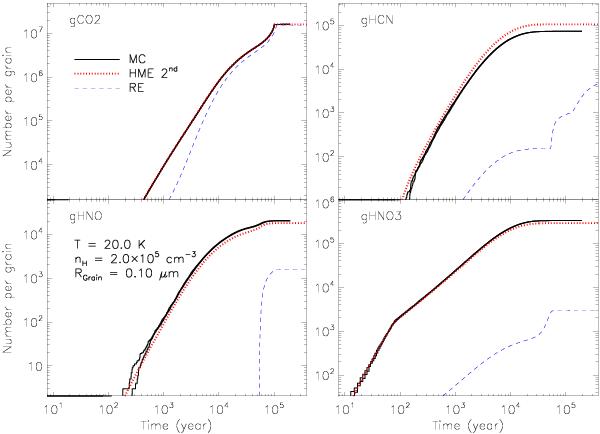
Typical time evolution of the average populations of certain species from MC (solid lines), HME to the 2nd order (dotted lines), and RE (dashed lines). Note that the Monte Carlo has been repeated twice. The y-axis is the number of each species in a volume containing exactly one grain. To translate it into abundance relative to H nuclei, it should be multiplied by 2.8 × 10⁻¹². Physical parameters used: T = 20 K, n = 2 × 105 cm-3, grain radius = 0.1 μm.
Current usage metrics show cumulative count of Article Views (full-text article views including HTML views, PDF and ePub downloads, according to the available data) and Abstracts Views on Vision4Press platform.
Data correspond to usage on the plateform after 2015. The current usage metrics is available 48-96 hours after online publication and is updated daily on week days.
Initial download of the metrics may take a while.