Free Access
Fig. 20
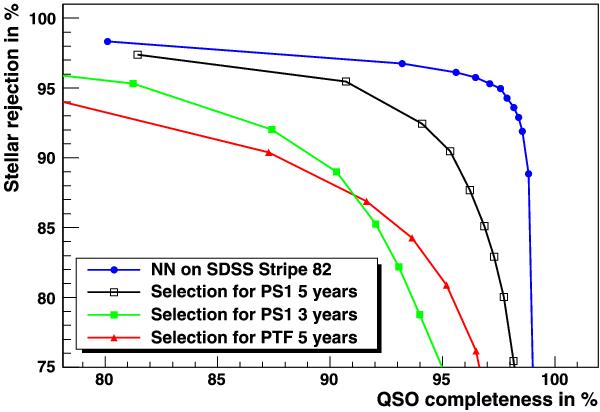
Stellar rejection vs. quasar completeness for the full Stripe 82 data (blue dots), for the Pan-STARRS (green and black squares) and for the PTF (red triangles) simulated data. In each case, the threshold on the relevant variability NN is increased from right to left.
Current usage metrics show cumulative count of Article Views (full-text article views including HTML views, PDF and ePub downloads, according to the available data) and Abstracts Views on Vision4Press platform.
Data correspond to usage on the plateform after 2015. The current usage metrics is available 48-96 hours after online publication and is updated daily on week days.
Initial download of the metrics may take a while.