Fig. 16
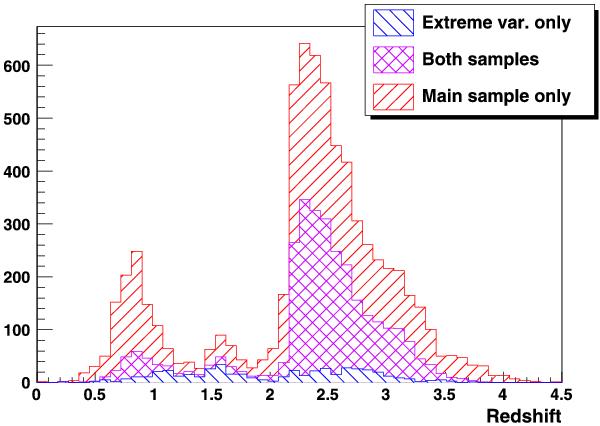
Stacked redshift distribution of the confirmed quasars, where the histograms represent the number of quasars in each of the non-overlapping samples. The total extreme-variability sample is thus illustrated by the blue+purple surface, while the total main sample is in purple+red. The emphasis of the selection on z > 2.15 objects is apparent.
Current usage metrics show cumulative count of Article Views (full-text article views including HTML views, PDF and ePub downloads, according to the available data) and Abstracts Views on Vision4Press platform.
Data correspond to usage on the plateform after 2015. The current usage metrics is available 48-96 hours after online publication and is updated daily on week days.
Initial download of the metrics may take a while.