Free Access
Fig. 14
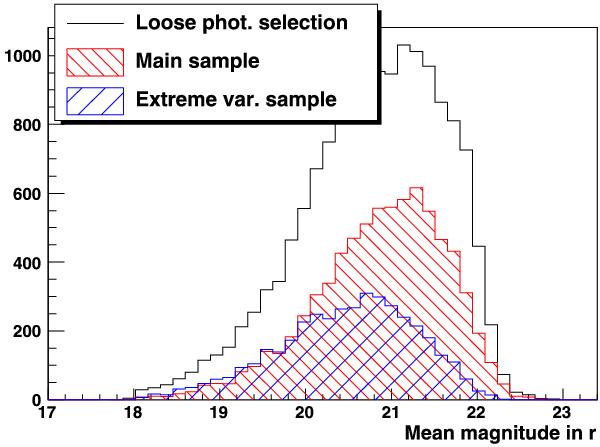
Distribution of the magnitude in r at the stage of loose color-based preselection (black histogram), and after the final variability-based selection leading to the main sample (red histogram). The targets of the extreme variability program are shown as the blue histogram.
Current usage metrics show cumulative count of Article Views (full-text article views including HTML views, PDF and ePub downloads, according to the available data) and Abstracts Views on Vision4Press platform.
Data correspond to usage on the plateform after 2015. The current usage metrics is available 48-96 hours after online publication and is updated daily on week days.
Initial download of the metrics may take a while.