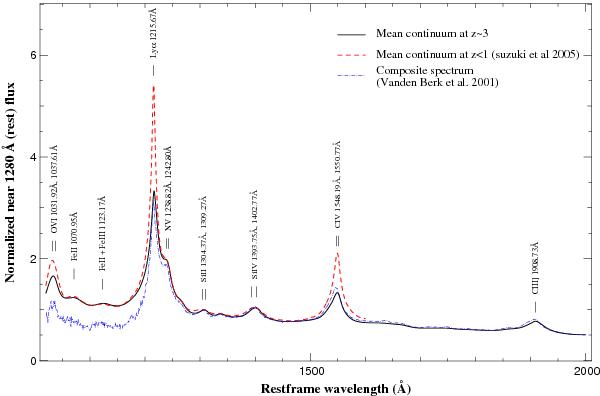
Fig. 6

The solid black (dashed red) line is the mean continuum of quasars at z = 3 (z ≤ 1, S05). The wavelength coverage at z = 3 corresponds to SDSS spectra and is larger than at z ≤ 1. The main difference between the two mean spectra is visible in the amplitude of emission lines. The composite spectrum from Vanden Berk et al. (2001) computed from 2200 SDSS spectra (dash-dot blue line) is agrees well with our mean continuum. The difference in the Lyman-α forest arises because Vanden Berk et al. (2001) did not try to avoid the absorption from the IGM. A small shift in the position of emission lines can be noticed: this is because Vanden Berk et al. (2001) have used the Mg ii line as a reference to compute the redshift, whereas we used the C iv and C iii] lines.
Current usage metrics show cumulative count of Article Views (full-text article views including HTML views, PDF and ePub downloads, according to the available data) and Abstracts Views on Vision4Press platform.
Data correspond to usage on the plateform after 2015. The current usage metrics is available 48-96 hours after online publication and is updated daily on week days.
Initial download of the metrics may take a while.


