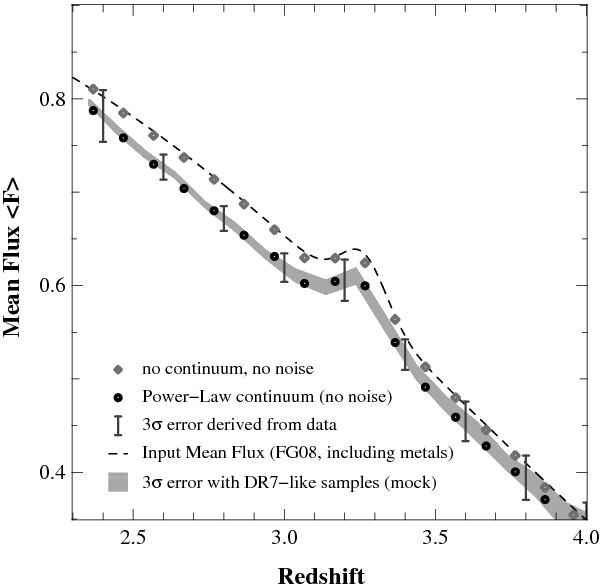
Fig. 17

Redshift evolution of the mean flux as measured from power-law continuum fitting of mock quasar spectra (black points and grey area). The evolution of the mean flux assumed as an input of the simulation is taken from Faucher-Giguère et al. (2008) (black dashed line). As already mentioned, the mean flux is underestimated by the power-law procedure but the shape of the evolution is recovered. Vertical grey bars are the errors expected from the data. They were computed from the errrors derived in the B03 sample (see Fig. 15), scaled with respect to the different number of spectra in the SDSS-DR7 and B03 samples. They are larger than the errors derived from the simulations (grey area), as expected.
Current usage metrics show cumulative count of Article Views (full-text article views including HTML views, PDF and ePub downloads, according to the available data) and Abstracts Views on Vision4Press platform.
Data correspond to usage on the plateform after 2015. The current usage metrics is available 48-96 hours after online publication and is updated daily on week days.
Initial download of the metrics may take a while.


