Fig. 1
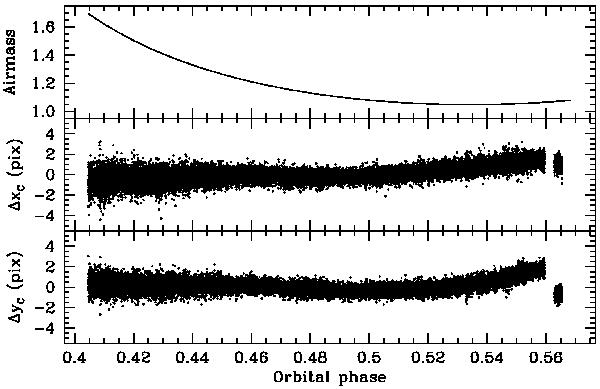
Upper panel: the range of airmass covered during the run. Mid and bottom panels: the variation around the median values of the position of the centroid of the stellar psf on the detector. The positions of those images that were discarded because of pointing jumps whose amplitude is larger than the plotted range are not shown for the sake of clarity.
Current usage metrics show cumulative count of Article Views (full-text article views including HTML views, PDF and ePub downloads, according to the available data) and Abstracts Views on Vision4Press platform.
Data correspond to usage on the plateform after 2015. The current usage metrics is available 48-96 hours after online publication and is updated daily on week days.
Initial download of the metrics may take a while.