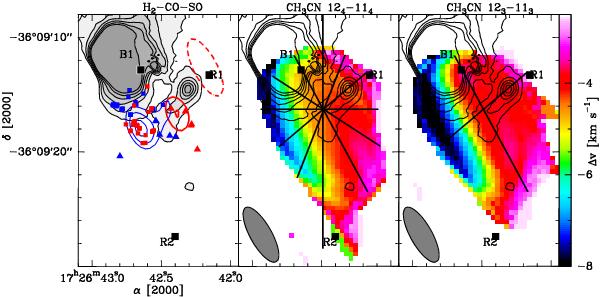
Fig. 9

Summary of the high angular resolution observations available for the IRAS 17233 cluster (see previous figures for details and references). Left: maps of the H2 emission (grey and solid contour levels). The blue and red contours represent the SO(56−45) blue- and red-shifted emission; the dashed red contour is the CO(2−1) red-shifted emission at extremely high velocities. Overlaid on the map are also the positions of the blue and red OH (squares) and H2O (triangles) masers. Middle: overlay of the CH3CN(124–114) first moment map (colour scale) with the H2 emission map (black contours). The black lines represent the directions used in the position-velocity plots of Fig. 12 and are: the OF1 axis; the OF2–OF3 axis (NE–SW line); the N-S and E-W directions; the cuts with position angles of –20 and 60°. Right: overlay of the CH3CN(123–113) first moment map (colour scale) with the H2 emission map (black contours). The black lines represent the axes of the OF1 and OF2–OF3 outflows. The R1, R2 and B1 positions in OF1 and OF2–OF3 respectively are marked by black squares.
Current usage metrics show cumulative count of Article Views (full-text article views including HTML views, PDF and ePub downloads, according to the available data) and Abstracts Views on Vision4Press platform.
Data correspond to usage on the plateform after 2015. The current usage metrics is available 48-96 hours after online publication and is updated daily on week days.
Initial download of the metrics may take a while.


