Fig. 4
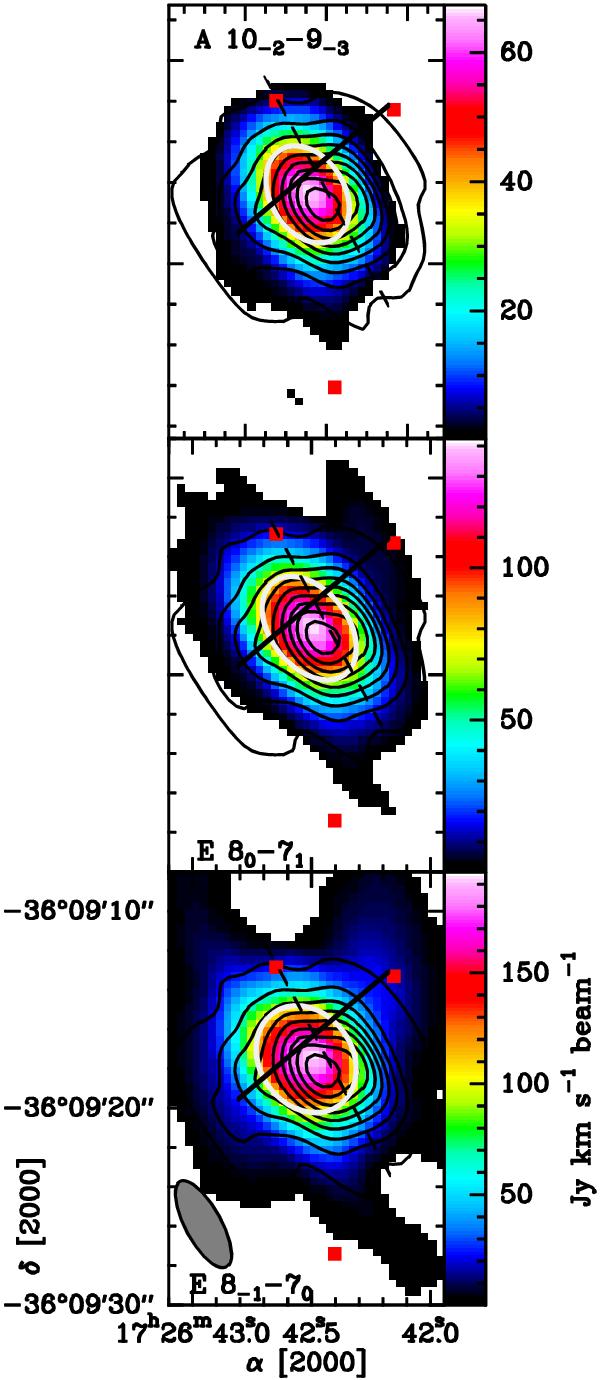
Integrated emission of selected transitions of CH3OH in the region above the 5σ detection in the line data cubes (~0.5 Jy beam-1). The black solid contours show the 1.3 mm continuum emission as in Fig. 2. The solid line shows the axis of OF1, while the dashed line has been chosen, for sake of clarity, to represent the three possible directions of the N–S outflows drawn in Fig. 1. The red squares mark the R1, R2 and B1 peaks of the CO(2−1) emission detected towards OF1 and OF2–OF3 (see Fig. 1a). The white ellipse represents the FWHM 2-D Gaussian fit to the data.
Current usage metrics show cumulative count of Article Views (full-text article views including HTML views, PDF and ePub downloads, according to the available data) and Abstracts Views on Vision4Press platform.
Data correspond to usage on the plateform after 2015. The current usage metrics is available 48-96 hours after online publication and is updated daily on week days.
Initial download of the metrics may take a while.