Fig. 4
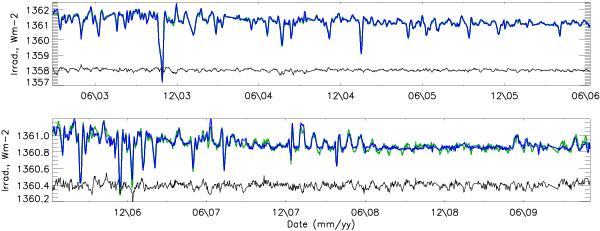
Irradiance lightcurves of TIM (green) and SATIRE-S integrated over 200 − 160 000 nm (blue) between 25 February 2003 and 1 November 2009. The upper plot shows the first half of the period and the irradiance scale covers 5.5 W m-2 while the lower half is on a reduced irradiance scale of 1.0 W m-2 to highlight the differences in the quieter minimum period of 2008 and 2009. The black line shows the difference between TIM and SATIRE-S TSI, shifted up by 1358 W m-2 in the upper frame and by 1360.4 W m-2 in the lower.
Current usage metrics show cumulative count of Article Views (full-text article views including HTML views, PDF and ePub downloads, according to the available data) and Abstracts Views on Vision4Press platform.
Data correspond to usage on the plateform after 2015. The current usage metrics is available 48-96 hours after online publication and is updated daily on week days.
Initial download of the metrics may take a while.