Fig. 10
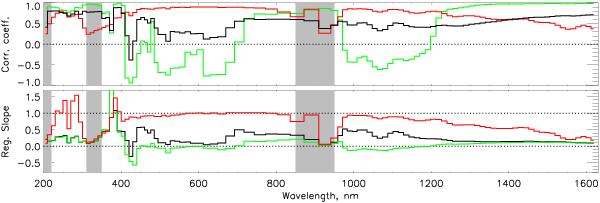
Correlation coefficents (top) and regression slopes (bottom) between SIM and SATIRE-S as a function of wavelength for the spectrum from 200 − 1630 nm. For λ < 450 nm wavelengths are compared in 10 nm bins; for λ > 450 nm bins are resolution elements of SIM. There are three types of comparison made for each bin over the time period of 21 April 2004 to 1 November 2009: (black) original data, (red) detrended, short-term and (green) smoothed or long-term. Greyed-out regions highlight the detector edges where the signal is comparable to the instrument noise. Dotted lines are to aid the reader.
Current usage metrics show cumulative count of Article Views (full-text article views including HTML views, PDF and ePub downloads, according to the available data) and Abstracts Views on Vision4Press platform.
Data correspond to usage on the plateform after 2015. The current usage metrics is available 48-96 hours after online publication and is updated daily on week days.
Initial download of the metrics may take a while.