Free Access
Fig. 1
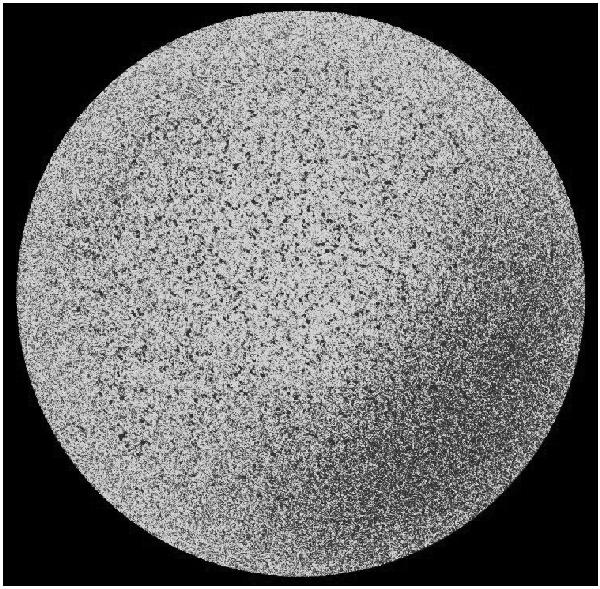
A 5-min magnetogram showing |B| taken by MDI on SoHO on 23 December 2008. Darker regions have a higher flux. Note the dark-area in the south-west quadrant, a bias present in all MDI magnetograms.
Current usage metrics show cumulative count of Article Views (full-text article views including HTML views, PDF and ePub downloads, according to the available data) and Abstracts Views on Vision4Press platform.
Data correspond to usage on the plateform after 2015. The current usage metrics is available 48-96 hours after online publication and is updated daily on week days.
Initial download of the metrics may take a while.