Free Access
Fig. 3
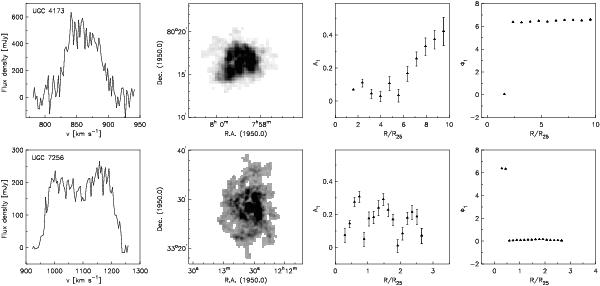
Global profile (left panels), H i intensity distribution and the distribution of A1 (middle panels), and the distribution of the phase φ1 (right panels) of two example galaxies, UGC 4173 (upper row) and UGC 7256 (lower row).
Current usage metrics show cumulative count of Article Views (full-text article views including HTML views, PDF and ePub downloads, according to the available data) and Abstracts Views on Vision4Press platform.
Data correspond to usage on the plateform after 2015. The current usage metrics is available 48-96 hours after online publication and is updated daily on week days.
Initial download of the metrics may take a while.