Fig. 2
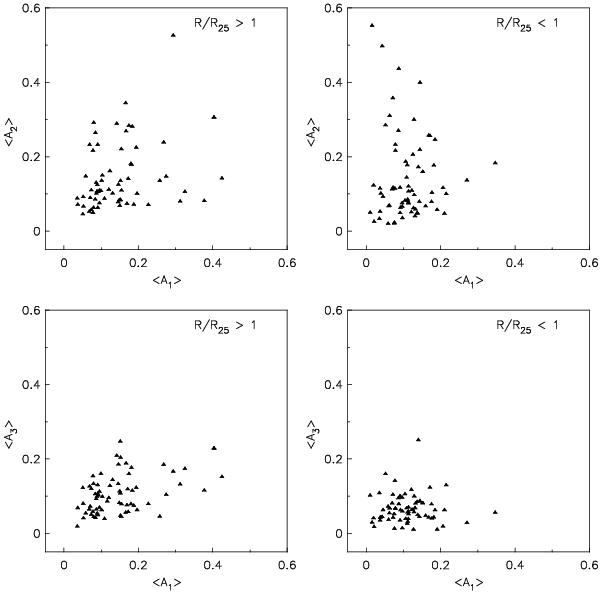
A comparison of the mean values of the fractional amplitudes of the first three Fourier components of the H i surface density distribution. Upper row: ⟨ A2 ⟩ vs. ⟨ A1 ⟩ for large and small radii, beyond and within the optical radius, respectively. The ⟨ A2 ⟩ values denoting bars and two-armed spirals dominate over lopsidedness within the optical radius, for amplitudes > 0.2. Thus, strong bars are more likely in the inner galaxy than very strong lopsidedness. Lower row: ⟨ A3 ⟩ vs. ⟨ A1 ⟩ for large and small radii, the ⟨ A3 ⟩ values are smaller than lopsided amplitudes, especially at large radii.
Current usage metrics show cumulative count of Article Views (full-text article views including HTML views, PDF and ePub downloads, according to the available data) and Abstracts Views on Vision4Press platform.
Data correspond to usage on the plateform after 2015. The current usage metrics is available 48-96 hours after online publication and is updated daily on week days.
Initial download of the metrics may take a while.