Fig. 8
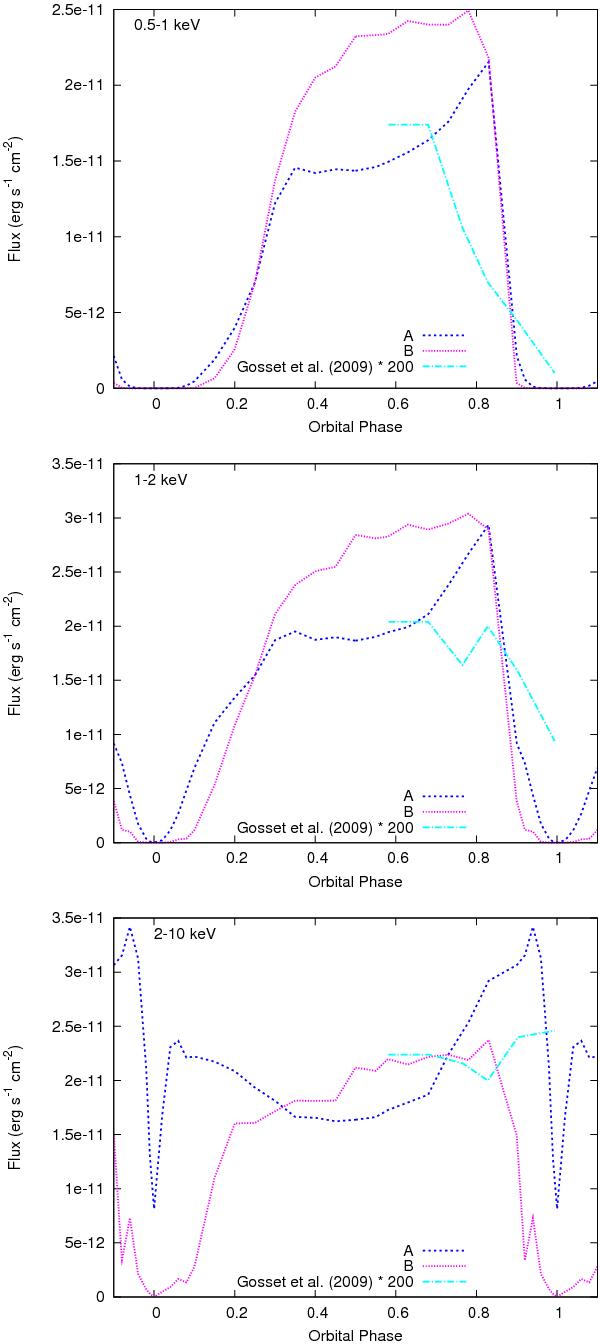
X-ray lightcurves calculated from models A and B in the 0.5–1 (upper panel), 1–2 (middle panel), and 2–10 keV (lower panel) energy bands. The values derived by G09 from spectral fits to XMM-Newton spectra are plotted for comparison – note that they have been rescaled (upwards) by a factor of 200 for illustrative purposes. Note the difference in scale between the plots.
Current usage metrics show cumulative count of Article Views (full-text article views including HTML views, PDF and ePub downloads, according to the available data) and Abstracts Views on Vision4Press platform.
Data correspond to usage on the plateform after 2015. The current usage metrics is available 48-96 hours after online publication and is updated daily on week days.
Initial download of the metrics may take a while.