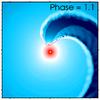
Fig. 4
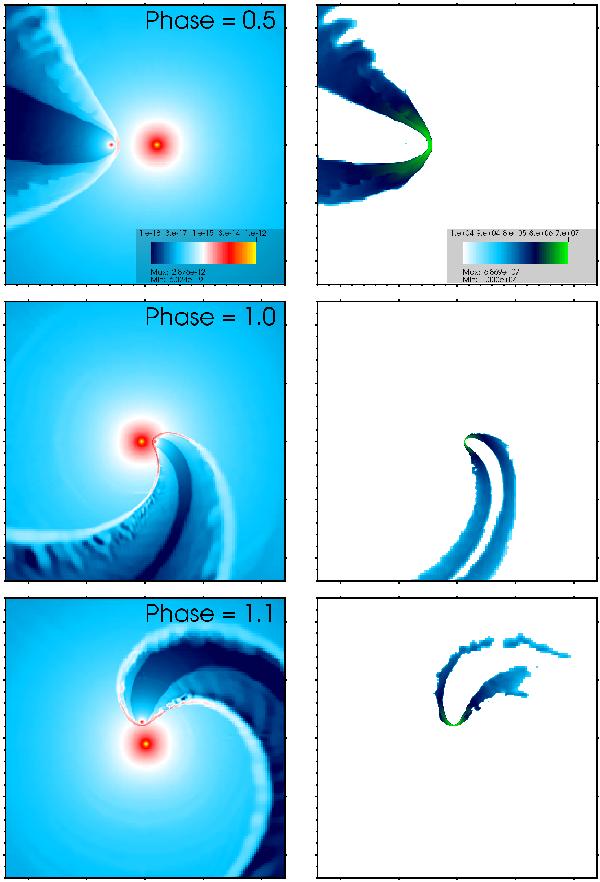
Snapshots of the gas density (left column) and temperature (right column) in the orbital (x − y) plane from model A (instantaneously accelerated winds) at φ = 0.5 (upper panels), 1.0 (middle panels), and 1.1 (lower panels). The orbital motion of the stars is calculated in the centre of mass frame. At apastron (φ = 0.5) the WR star is to the right, and the O star is to the left, of the image centre. The motion of the stars proceeds in an anti-clockwise direction. All plots show a region of ± 1.2 × 1014cm – large axis tick marks correspond to a distance of 5 × 1013cm.


Current usage metrics show cumulative count of Article Views (full-text article views including HTML views, PDF and ePub downloads, according to the available data) and Abstracts Views on Vision4Press platform.
Data correspond to usage on the plateform after 2015. The current usage metrics is available 48-96 hours after online publication and is updated daily on week days.
Initial download of the metrics may take a while.