Fig. 11
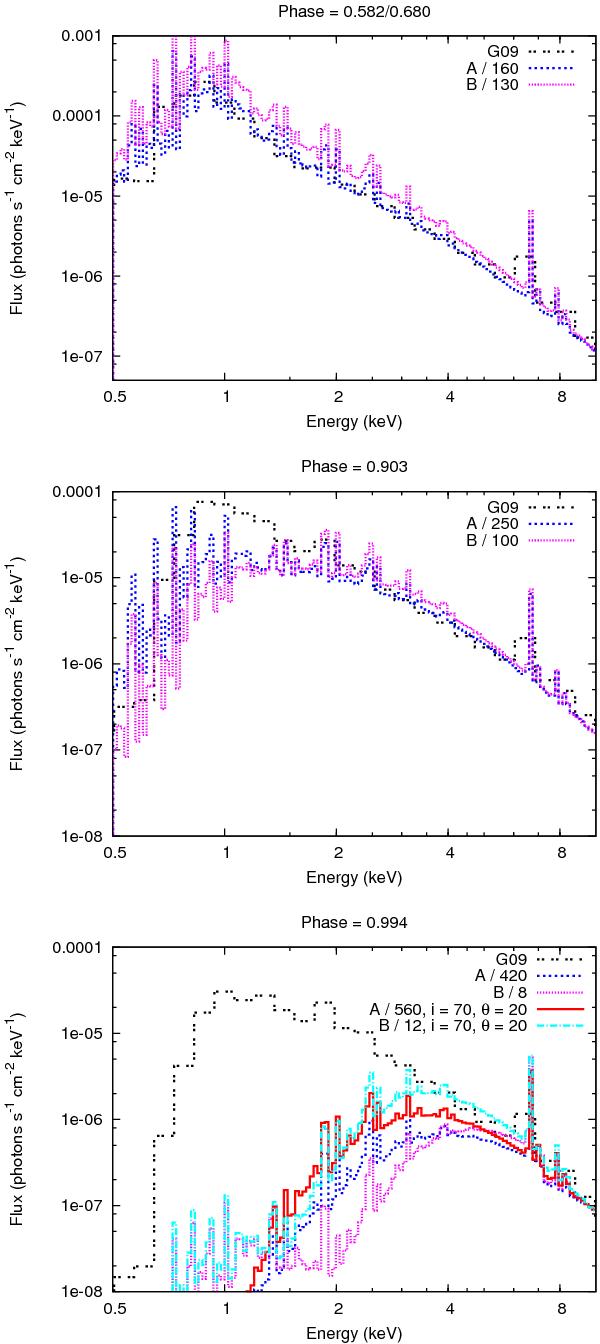
0.5–10 keV X-ray spectra calculated from models A and B at φ = 0.630 (upper panel), 0.903 (middle panel) and 0.994 (lower panel). Model spectra calculated at φ = 0.994 using viewing angles of i = 70° and θ = 20° are also shown in the lower panel. The best-fit model spectra from G09 are plotted for comparison (see Table 7 of G09). Note that the average φ = 0.582/0.680 spectrum of G09 is plotted in the upper panel. For illustrative purposes, the model A and B spectra have been rescaled by the factors noted in the plots to have an equivalent 10 keV flux. Note the difference in scale between the plots.
Current usage metrics show cumulative count of Article Views (full-text article views including HTML views, PDF and ePub downloads, according to the available data) and Abstracts Views on Vision4Press platform.
Data correspond to usage on the plateform after 2015. The current usage metrics is available 48-96 hours after online publication and is updated daily on week days.
Initial download of the metrics may take a while.