Free Access
Fig. 5
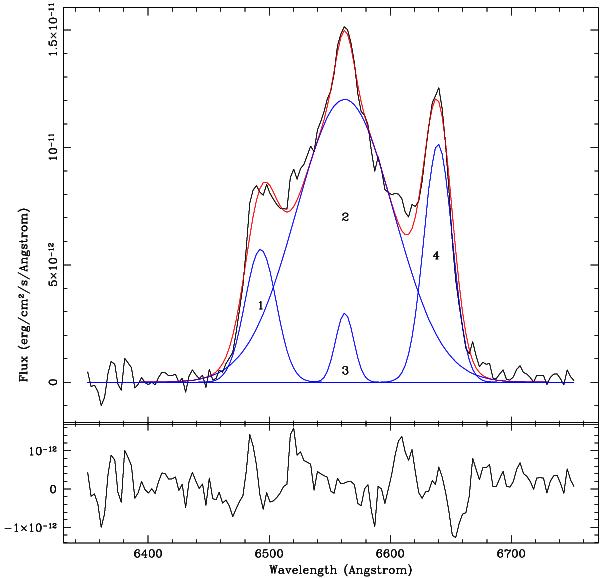
Observed Hα structure (black line) with the sum of Specfit Gaussian components (red line). The blue lines represent separate Gaussian components. See Sect. 3 for further discussion. The lower plot shows the residual to the fit.
Current usage metrics show cumulative count of Article Views (full-text article views including HTML views, PDF and ePub downloads, according to the available data) and Abstracts Views on Vision4Press platform.
Data correspond to usage on the plateform after 2015. The current usage metrics is available 48-96 hours after online publication and is updated daily on week days.
Initial download of the metrics may take a while.