Free Access
Fig. 5
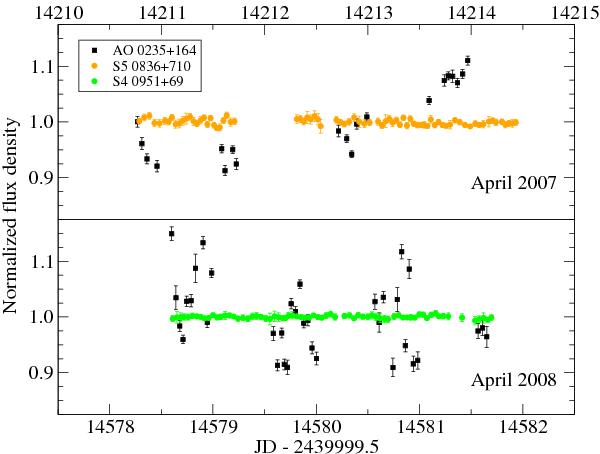
The variability curves of AO 0235+164 (black squares) in April 2007 (upper panel) and April 2008 (lower panel), compared with the curves of the calibrators S5 0836+710 (orange dots) and S4 0951+69 (green dots). The timescale of the variability in the two epochs differs considerably.
Current usage metrics show cumulative count of Article Views (full-text article views including HTML views, PDF and ePub downloads, according to the available data) and Abstracts Views on Vision4Press platform.
Data correspond to usage on the plateform after 2015. The current usage metrics is available 48-96 hours after online publication and is updated daily on week days.
Initial download of the metrics may take a while.