Fig. 2
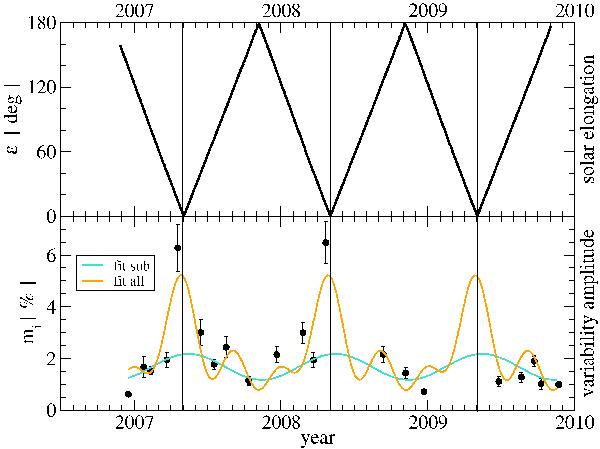
Solar elongation (upper panel) and modulation index (lower panel) of AO 0235+164 plotted versus observing time. The orange line shows the sum of the three variability components which correspond to the harmonics of the signal highlighted in the periodogram analysis in Fig. 3. The cyan line shows a sinusoidal fit obtained after removing the data-points corresponding to the two epochs at smallest solar elongation.
Current usage metrics show cumulative count of Article Views (full-text article views including HTML views, PDF and ePub downloads, according to the available data) and Abstracts Views on Vision4Press platform.
Data correspond to usage on the plateform after 2015. The current usage metrics is available 48-96 hours after online publication and is updated daily on week days.
Initial download of the metrics may take a while.