Free Access
Fig. 8
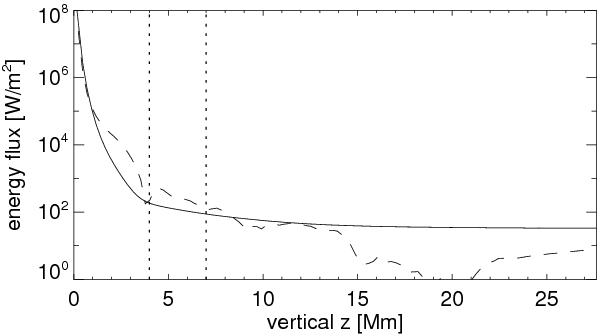
Horizontal, averaged, upwardly directed heat flux (solid) derived from volumetric heating rate. Horizontally averaged absolute Poynting flux is overplotted as a dashed line. Both are derived from one snapshot in time. Vertical dotted lines as in Fig. 3.
Current usage metrics show cumulative count of Article Views (full-text article views including HTML views, PDF and ePub downloads, according to the available data) and Abstracts Views on Vision4Press platform.
Data correspond to usage on the plateform after 2015. The current usage metrics is available 48-96 hours after online publication and is updated daily on week days.
Initial download of the metrics may take a while.